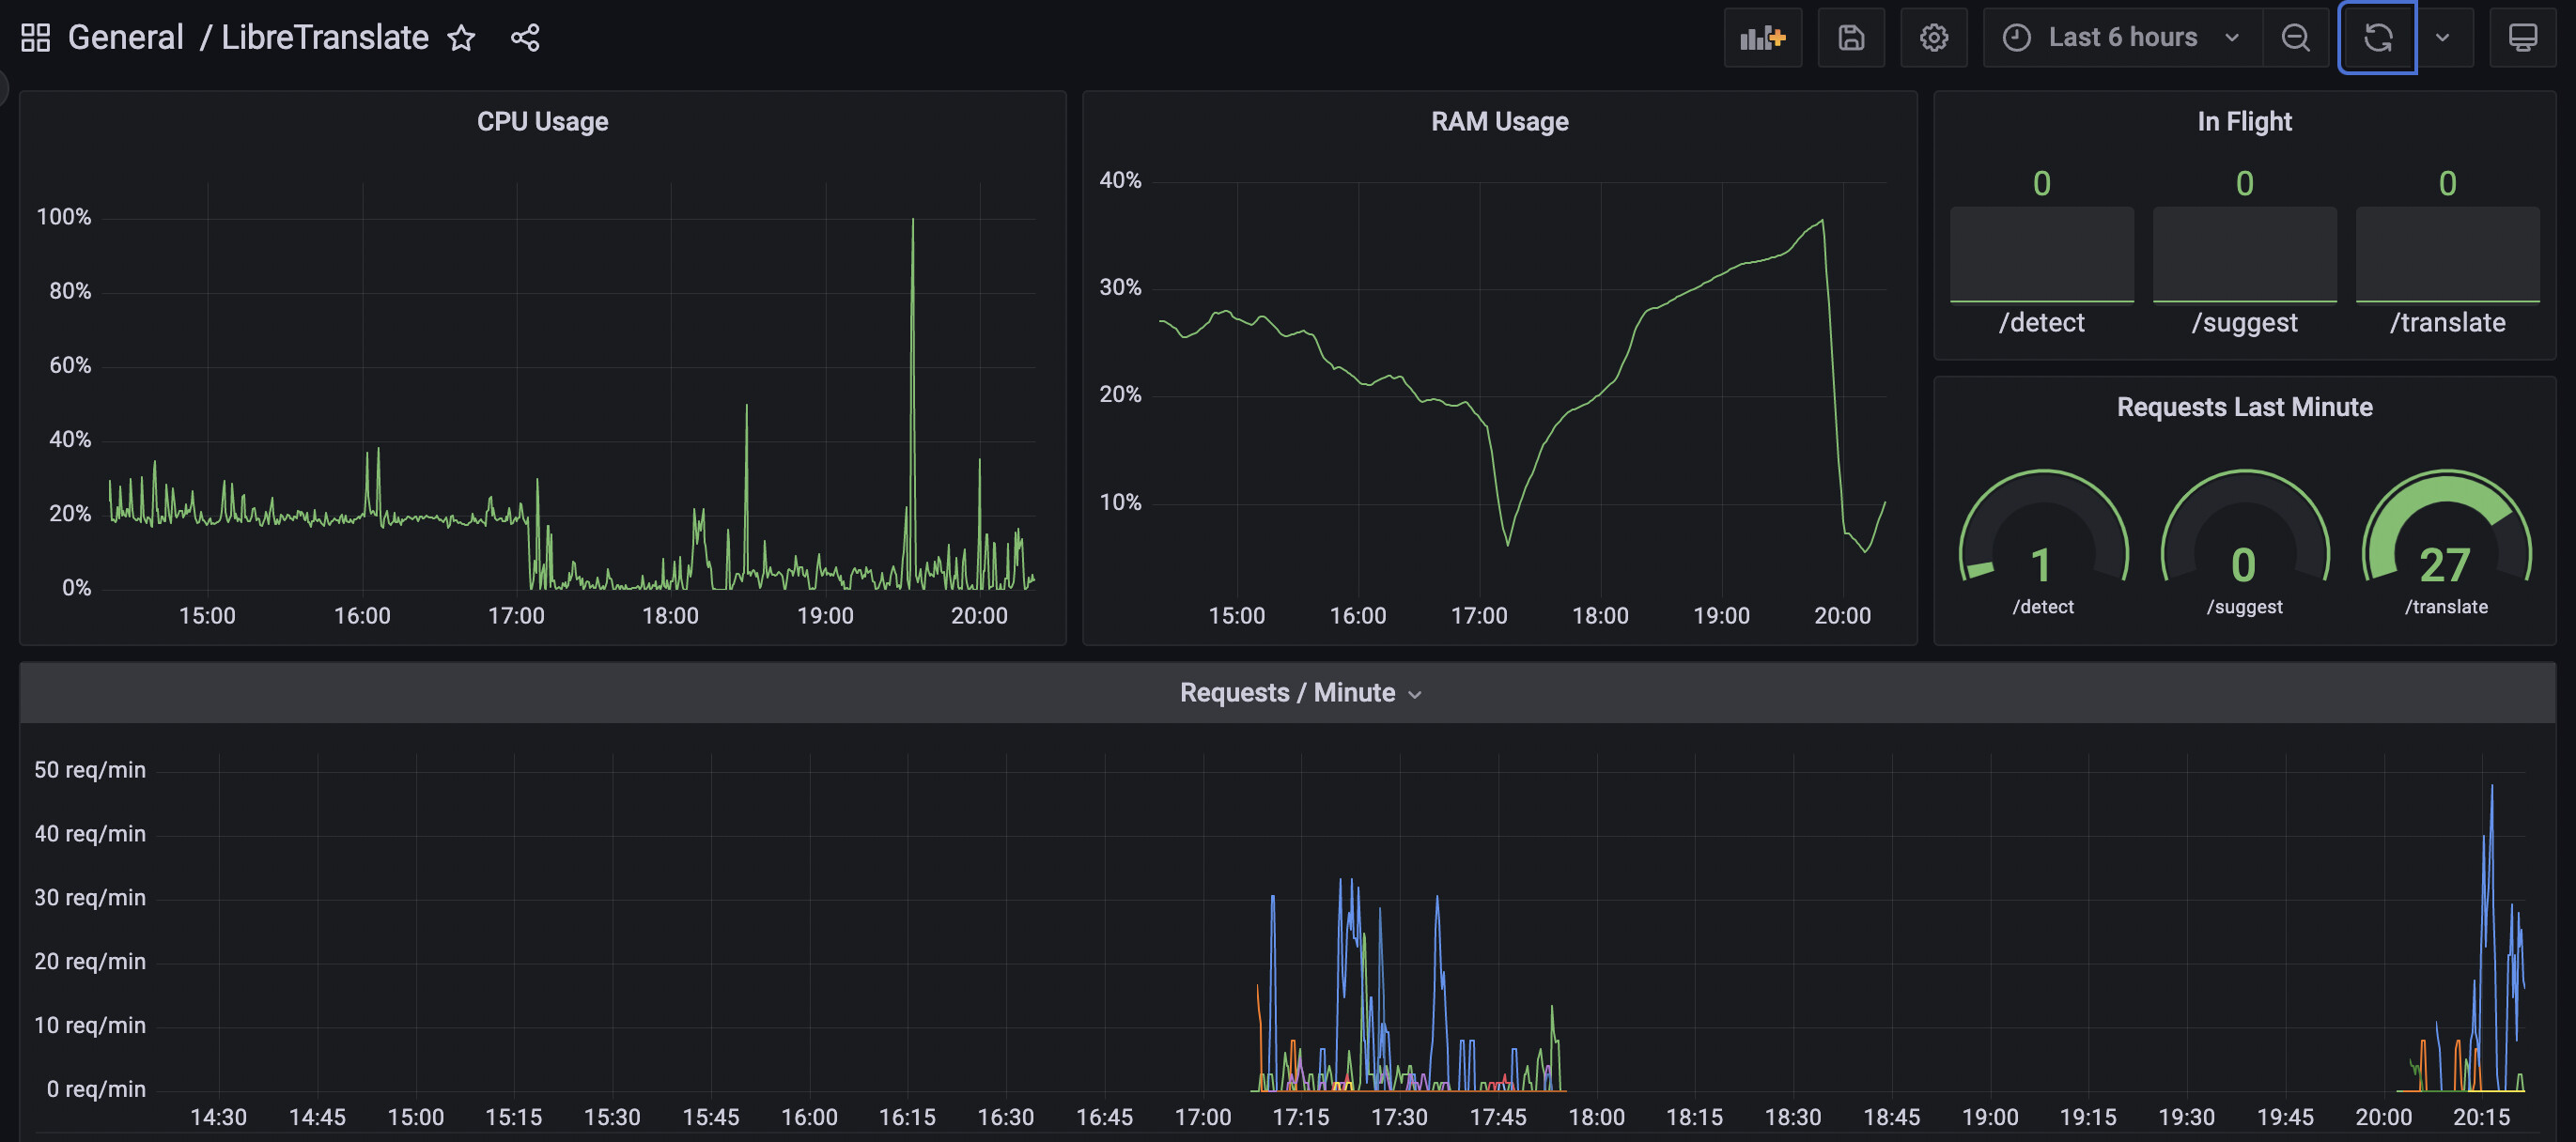
With https://github.com/LibreTranslate/LibreTranslate/pull/368 people can now setup dashboards (via Grafana + Prometheus) for monitoring activity on a server.
Here’s an example:
With https://github.com/LibreTranslate/LibreTranslate/pull/368 people can now setup dashboards (via Grafana + Prometheus) for monitoring activity on a server.
Here’s an example: